-
E-mail
630@tilo.cn
-
Phone
18938632606
-
Address
Building 8, Xili Nangang Second Industrial Park, Nanshan District, Shenzhen
Product Categories
Shenzhen Tianyouli Standard Light Source Co., Ltd


TE95 EIAJ Test Card A/ITE Resolution Card Transmission Type
NegotiableUpdate on 02/28
- Model
- Nature of the Manufacturer
- Producers
- Product Category
- Place of Origin
Overview
Camera test card customization is a specially made image card based on the customer's own camera testing needs. With the rise of the high-definition camera industry, including mobile phones, security, automobiles, and other industries, the detection of high-definition cameras cannot do without high-definition image cards and standard testing environments. 3nh provides customized standard light sources, and the customization of test image cards includes high-definition resolution test cards, color restoration test cards, grayscale test cards, distortion test cards, and other project image cards for camera testing. Color test card
Product Details
Color test card
Camera test card customization is a specially made image card based on the customer's own camera testing needs. With the rise of the high-definition camera industry, including the prosperity of mobile phones, security, automobiles and other industries, the detection of high-definition cameras cannot be separated from high-definition image cards and standard testing environments. 3nh provides customized standard light sources, and the customization of test image cards includes high-definition resolution test cards, color restoration test cards, grayscale test cards, distortion test cards and other project image cards for camera testing
TE183 logarithmic grayscale test card test card (reflective type)
Two 11 degree grayscale bars are arranged in opposite directions on a gray background (D=0.62), and the grayscale bars are scaled logarithmically (gamma=0.45). The output signal of a gamma corrected camera produces two opposite 11 degree linear step signals. The contrast range of grayscale is 40:1.Color test card
The values of the 11 degree grayscale in the card are shown in the following table:
|
Step Grayscale level |
Density density |
Reflectance in % reflectance |
1 |
0.05 |
89 |
2 |
0.13 |
74 |
3 |
0.22 |
60 |
4 |
0.32 |
48 |
5 |
0.43 |
37 |
6 |
0.55 |
28 |
7 |
0.69 |
20 |
8 |
0.86 |
14 |
9 |
1.06 |
9 |
10 |
1.31 |
5 |
11 |
1.65 |
2 |
The density of the white area between the two grayscale bars is D=0.05 (reflectivity=89%).
TE153DLogarithmic Gray Scale Test Card (Transmission Type)
Two 11 degree grayscale bars are arranged in opposite directions on a gray background (D=0.56), with the grayscale bars marked on a logarithmic scale. Grayscale density: Gamma=0.45. Transmittance value (brightness): Gamma=2.2, which is exactly the inverse of Gamma=0.45. The output signal of a gamma corrected camera produces two opposite 11 degree linear step signals. The contrast range of grayscale is 44:1.
The values of the 11 degree grayscale in the card are shown in the following table:
|
Step Grayscale level |
Density density |
Transmissionin% transmittance |
1 |
0.05 |
89 |
2 |
0.13 |
74 |
3 |
0.22 |
60 |
4 |
0.34 |
48 |
5 |
0.44 |
37 |
6 |
0.56 |
28 |
7 |
0.70 |
20 |
8 |
0.88 |
13 |
9 |
1.08 |
8 |
10 |
1.34 |
5 |
11 |
1.70 |
2 |
The density value is based on the white part of the zebra crossing. Two black squares and one white square are located in the middle of two grayscale bars, and the density of the black squares is D>3.0 (transmittance<0.1%). The density of the white square is D=0.05 (transmittance=89.9%).

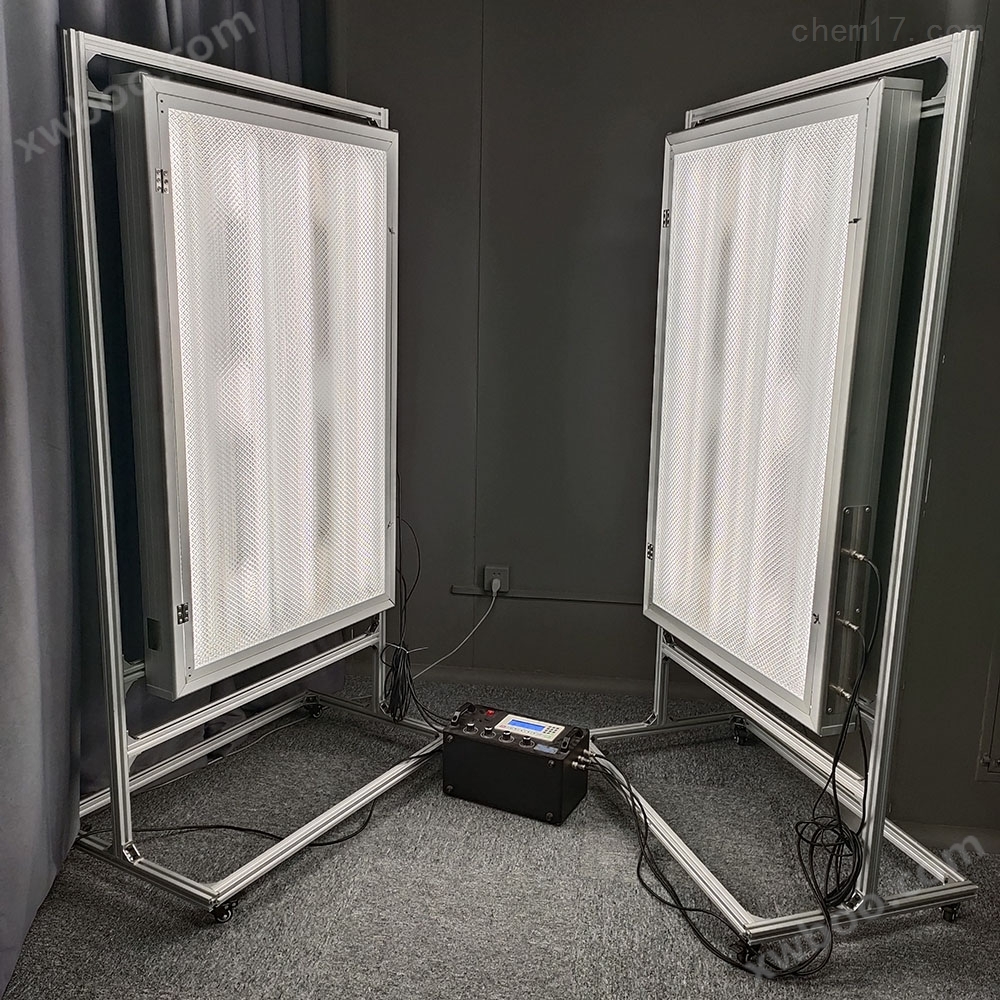
TE95 EIAJTest card A/ITE resolution card transmission type
TE95The test card is designed for the general visual evaluation of electronic cameras.
The density of the four grayscale bars in the test card gradually increases from D=0.15 to D=1.35 (contrast ratio 11:1) with a quantitative increase of D=0.15. The contrast of the white area in the image (transmittance=100%, D=0) is 22:1. The density of the gray area around the white area is D ≈ 0.25 (transmittance=57%).
This test card is first designed to evaluate the positioning performance of electronic camera transmission characteristics.
The circular chart in the test card allows for a rough evaluation of linear scanning performance. The 200 line grating distributed throughout the card can monitor linear distortions in both horizontal and vertical directions. The distance between the white and black lines should be equal.
Due to the oscilloscope with line selection function, the vertical wedge-shaped grating enables the frequency response of modulation depth to be established. The signal from the 200 pole can be used as a reference value. Wedge gratings can further achieve visual evaluation of resolution limits. In addition, the effects of cross color interference, notch filters, and makeup filters can also be observed.
The horizontal bar chart above and below the grayscale bar can display transmission characteristic information in the medium frequency range. Gray scale bars can provide a rough evaluation of the half tone reception performance; Due to the surrounding white area, it is not possible to obtain exact results.
The four diagonal lines in the grid composed of grayscale bars can be used to detect the feature of line intersection. The ladder like reception of lines represents paired lines.
TE97AHigh resolution test card reflective
TE97Corresponding to the 4:3 section of the HDTV test card TE117. It is designed to measure and quickly visually evaluate the image transmission characteristics of high-resolution non broadcast cameras.
This test card has a gray background area (D=0.75; reflectivity=18%), which is a white circle with 11 degree gray bars in each of the four directions of the white circle. The grayscale of these four gray bars gradually changes in a linear equal amount from D=0.15 to D=1.65, which can be used to check the half tone reproduction performance of the camera. Due to the surrounding white area, the inspection results will be very reliable.
Four small circles with resolution wedges are arranged around the large circle.
All frequency values on the test card are expressed in cph (number of turns per unit height). In the large circle, three resolution wedges of different frequencies are arranged horizontally and vertically. Their frequencies range from 100 to 250, 200 to 500, 400 to 1000 cph, respectively. In addition, there are two resolution wedges intersecting vertically at the center, with frequencies ranging from 200 to 500 cph.
There are four small squares composed of lines in the center and on the left and right sides of the test card, and the inclined lines form the0°,45°,90°,135°The inclination angle generates different frequencies in both horizontal and vertical directions141.4cphA rough linear scan evaluation can be made using the white circle and the four outer small circles. There is a cross shaped resolution wedge inside the small outer circle. The small circle inside the circle is designed to indicate the resolution in both horizontal and vertical directions, and can also be used to detect geometric distortions. What is the resolution level tested on this card200,300,400,600and800cph.
In the white and gray areas above and below the middle of the test card, there are seven bar element diagrams arranged, with lengths in sequence1(=Like half the height),2,4,8,16,32and64cphOn the left side of the vertical grayscale bar on the right, there is another one5A short pole element, representing in sequence100,300,500,700and900cph.

TE128D ITEHigh resolution test card 16:9
TE128It is designed for measuring and rapidly visually evaluating the image transmission characteristics of high-resolution non broadcast cameras.
Its constituent elements include a gray background, a white circle, grayscale bars, multi wave group test images, resolution wedge images of different frequencies in the horizontal and vertical directions, and circles.
TE117AHigh definition TV universal test card 16:9 reflective
TE117It is designed for rapid visual evaluation of the image transmission characteristics of high-definition television cameras.
In the gray background area of this test card (D=0.75; transmittance=18%), there is a white circle with grayscale bars and a resolution wedge image inside.Four small circles with resolution wedge plots are arranged around the large circle.
16:9The format is indicated by four hollow arrows located on the horizontal and vertical centerline. In addition, four hollow arrows located close to the circle on the upper and lower edges of the image indicate4:3The format. Therefore, this test card can also be used to test 4:3 cameras.
There are 11 degree grayscale bars in each of the four directions within the white circle. The grayscale of these four gray bars gradually increases in a linear equal amount from D=0.15 to D=1.65, which can be used to check the halftone reproduction performance of high-definition cameras. Due to the surrounding white area, the inspection results will be very reliable.
All frequency values on the test card are usedcph(The number of lines per unit of height) represents. Within the large circle, three wedge-shaped graphs of different frequencies are arranged horizontally and vertically. Their frequencies range from 100Up to 250,200Up to 500,400to1000cphIn addition, there are two resolution wedge plots intersecting vertically at the center, with a frequency of200to5000cph.
At the center and on the left and right sides of the test card, there are four small squares composed of line gratings, each tilted to form a grid0°,45°,90°,135°dip angle. They generated a frequency of 200 cph. The grid line gratings that form 45 ° and 135 ° inclinations generate different frequencies (141.4 cph) in both horizontal and vertical directions. *The eight small circles outside the large circle are placed in 16:9 and 4:3 formats, respectively. Larger circles have a cross shaped resolution wedge diagram. The small circle inside the circle is designed to indicate the resolution in both horizontal and vertical directions, and can also be used to detect geometric distortions. What is the resolution level tested on this card200, 500660725 and 800cph.
The four peripheral circles located in the four corners have longer resolution wedge plots, with their intersections at 500 cph and marked with scales ranging from 200 to 800 cph.
In the white and gray areas above and below the middle of the test card, there are seven bar element diagrams arranged, with lengths in sequence1(=Like half the height),2,4,8,16,32and64cphOn the left side of the vertical grayscale bar on the right, there is another one5A short pole element, with values of 100, 300, 500, 700, and 900 cph respectively.
TE165A11Grayscale Test Card 16:9/BT.709 Reflective
Two 11 degree grayscale bars are arranged in opposite directions on a gray background (D ≈ 0.56), and the grayscale bars conform to ITU-BT.709.
Two opposite linear step signals are generated from the output signal of a camera that has undergone gamma correction based on BT.709. The contrast range of grayscale is 40:1. The values of the 11 degree grayscale in the card are shown in the following table:
|
Step Grayscale level |
Density density |
Remissionin% response rate |
VideosignalforBT.709in% BT.709The video signal rate |
Videosignalforgamma0.45in% Gamma 0.45 video signal rate |
1 |
0.05 |
89 |
100 |
100 |
2 |
0.13 |
74 |
91 |
92 |
3 |
0.22 |
60 |
82 |
84 |
4 |
0.32 |
48 |
73 |
75 |
5 |
0.43 |
37 |
64 |
67 |
6 |
0.56 |
28 |
55 |
59 |
7 |
0.70 |
20 |
46 |
51 |
8 |
0.88 |
13 |
37 |
43 |
9 |
1.08 |
8 |
28 |
35 |
10 |
1.34 |
5 |
19 |
26 |
11 |
1.64* |
2 |
11 |
19 |
The maximum density that can be printed using the production process of reflective test cards is 1.64. The target value for Zui black grayscale is 1.70. Therefore, there may be slight differences in the distance of the grayscale after Zui.
Two black blocks and one white block are located in the middle of two grayscale bars, with a density of D>3.0 (relief rate<0.1%) for the black blocks. The density of the white square is D=0.05 (relief rate 89.9%).
Adjust the aperture until the brightest block reaches 100% video signal on the waveform monitor. A camera calibrated according to ITU * BT.709 * will achieve a signal level of 10% for the most black squares.
When using this card for 0.45 gamma correction, the video signal level of each grayscale will change according to the data listed in the table above.
TE223ALogarithmic Gray Scale Test Card Reflective
Two 13 degree grayscale bars are arranged in opposite directions on a gray background (D=0.75), and the grayscale bars are graded logarithmically. Grayscale density: Gamma=0.45, transmission value (brightness): Gamma=2.2, which is exactly the inverse of Gamma=0.45. The output signal of a gamma corrected camera produces two opposite 13 degree linear step signals.
The contrast range of grayscale is 200:1.
The values of the 13 degree grayscale in the card are shown in the following table:
|
Step Grayscale level |
Density density |
Reflectancein% reflectance |
1 |
0.05 |
89 |
2 |
0.13 |
74 |
3 |
0.21 |
62 |
4 |
0.30 |
50 |
5 |
0.40 |
40 |
6 |
0.51 |
31 |
7 |
0.63 |
23 |
8 |
0.78 |
17 |
9 |
0.95 |
11 |
10 |
1.15 |
7 |
11 |
1.41 |
4 |
12 |
1.77 |
2 |
13 |
2.35 |
0.5 |
Similar Product Recommend